Елена Пояркова, Ольга Калинина ЕГЭ по английскому языку 2022 (задние 40.2). Полный курс по подготовке к письменному заданию нового формата
Describing graphs vocabulary
●
Illustrate
The table illustrates that…
●
Reveal
(information)
The table reveals that…
●
Provide
(information/ differences )
The bar graph provides the differences between…
●
Present
The graph presents the information about…
●
Show
The graph clearly shows that… / The presented chart shows information about…
●
Indicate
As the chart indicates…
●
Depict
The provided diagram depicts…
●
According to..
.
According to the chart…
Complete the sentences.
1. The graph chart d__________ the differences about popular literature genres.
2. A__________ to the chart, fiction books are the most popular among readers.
3. The pie chart i__________ that people tend to use their computers for work more often.
4. The presented chart p__________ the information about the popularity of different car brands.
5. The graph s__________ i__________ about various types of magazines.
6. The chart r__________ two main features…
7. The table p__________ the contrast between popular computer games.
8. The bar chart c__________ sh__________ that the most popular game among teenagers is “X”.
Use given words to label the pictures.
chart bar chart pie chart graph table


______________________________ 2. ______________________________


3. ______________________________ 4. ______________________________
Which word can be used to describe any of the pictures given?
5. ______________________________
Analyzing the data
●
As a general trend, …
As a general trend, horror films appear to be the most popular among teenagers.
●
As can be seen, …
As can be seen, paying for purchases is the least common aim of smartphone usage.
●
As an overall trend, …
As an overall trend, loyal users of mobile phones seem to be growing.
●
At first glance, it is clear…
At first glance, it is clear that there's something different going on here
●
…as is presented…
Teens tend to read fiction books more, as is presented in the bar chart.
Paraphrase the sentences, using the phrases above:
Teenagers watch American sitcoms all the time.
The bar chart shows that kids like playing hide-and-seek the most.
The pie chart shows that readers prefer detective stories to other books.
At first, it is obvious that not many tourists go to Ireland in summer.
The most popular phone brand among teenagers is Apple.
2. Choose the best opening statement.
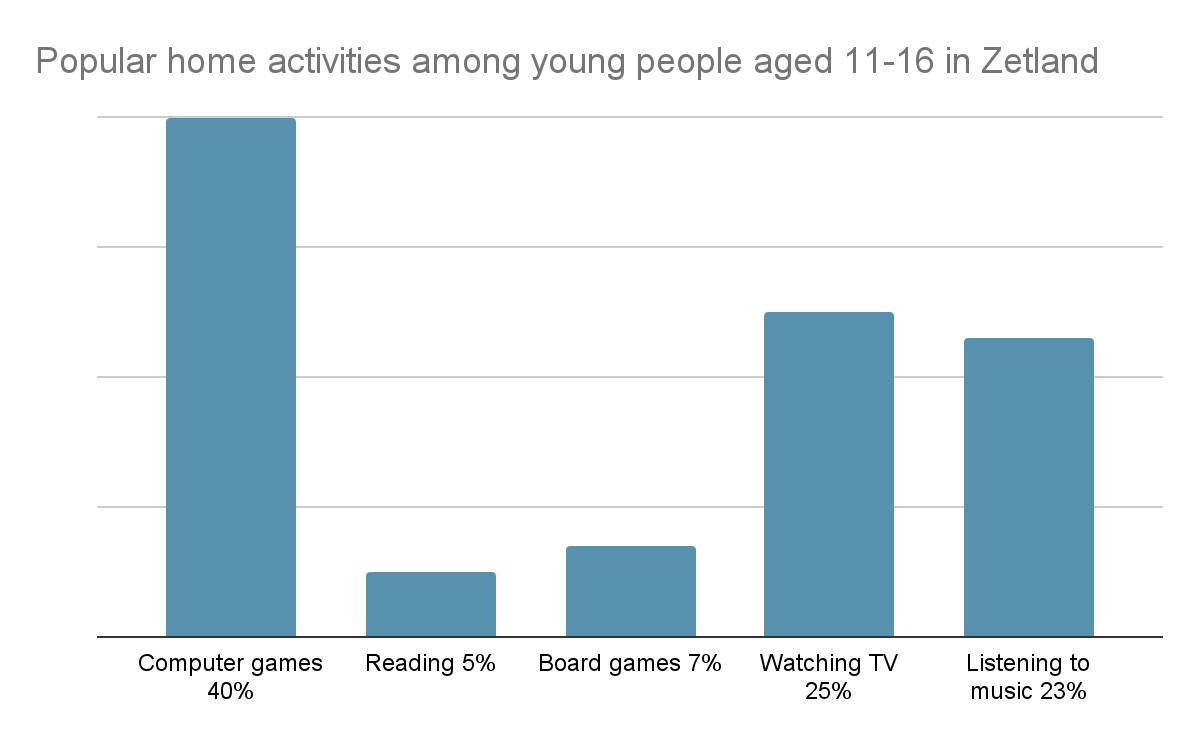
The bar chart shows the popularity of different home activities among teenagers.
Nowadays the rising generation chooses variable activities to spend their free time.The range of these interests depends on personal preferences, modern technologies and popularity.
Teenagers choose different home activities when they are at home. There are many home activities that are popular among teenagers, which are shown on the chart.
2. The bar chart shows what people use their smartphones for.
Smartphones are taking up too much of our time these days, but if people want to reduce their screen time, they have to understand the reason they need them so much.
Making phone calls is more important for people than playing games on smartphones, which is interesting, because real calls are becoming less and less popular.
3. The table reveals some information about what book genres are popular among teenagers.
Books can be helpful for your study and you can use them to read in your free time, but isn't it interesting to know, what types of books are more popular?
Reading is one of the most popular hobbies among different people. Surprisingly, teenagers living in a century of modern technologies are still interested in reading today. There are some interesting statistics on genres young people prefer to read.
Comparing information
General trends
Comparison
… by far the most popular item / product / language …
… much more popular than…
… the least popular product was …
… not as popular as …
…the highest percentage of….
… as popular as ...
…the lowest proportion of…
In contrast,…
By comparison,…
Extra vocabulary:
➢
2% = a very small proportion of
➢
20% = a fifth
➢
24% = almost a quarter
➢
25% = a quarter
➢
32% = nearly one-third
➢
35% = more than a third
➢
49% = just under a half
➢
50% = a half
➢
51% = just over a half
➢
55% = more than half
➢
70% = a large proportion of
➢
72% = a significant majority of
➢
…approximately…
➢
…nearly…
➢
…roughly…
➢
…almost…
➢
…just over…
➢
…just under…
➢
…just around…
➢
…just about…
➢
…just below…
➢
…a little more than…
➢
…a little less than…
Examples:
For example, …
For instance, …
A very good example is …
Conclusion
Conclusion
Opinion
Finally…
In my opinion,…
In conclusion….
In my mind,…
To sum up…
Personally, I believe....
In summary, ….
It seems to me that…
Therefore,....
I am convinced that….
Use the words from the table to complete sentences:
Many people say that smartphones can harm our eyes. P__________, ___ b___________ that we should reduce the screen time.
I__ c________ we see that Greece is one of the most popular tourists` destinations.
About 50% of citizens own two or more cars. T___________, they pay more taxes than the others.
Despite the common opinion, i__ s______ t__ m__ that milk isn`t healthy.
F__________, it is clear that rock music does not interest as many people as pop songs do.
I__ s____________, we need to take better care of the poor in our city.
We can s________ u___ the main point of the lesson in three sentences.
*
2. What do you think about pop music?
In my opinion,
Practical tasks

Analyse the diagram data and decide, whether the statements are true or false:
Most smartphone users need their electronic devices for sending emails and making phone calls, 79% and 78%, respectively. T / F
According to the diagram provided, it’s noticeable that smartphones are not often used to communicate with each other by emails and phone calls. T / F
According to the data, we can estimate that people use smartphones for playing games more than for surfing the Internet. T / F
79% of respondents need smartphones for exchanging emails, which is approximately 5 times bigger than the amount of people using them as a substitute for credit cards (15%). T / F
Less than 25% of the respondents use their smartphones to play games. T / F
One interesting fact is that the percentage of people using smartphones for playing games is significantly greater than those using it for purchases. T / F
2. Match the sentence halves to make a text, according to the diagram.
The aim of the project is to determine and ….
There are two main purposes ….
Firstly, smartphone users regularly …
Secondly, phones are often used to make calls. Almost every …
However, although most of us are used …
For instance, only 58 percent surf the Internet, 48 percent …
play games, and a mere 15 percent use phones for paying for purchases.
to checking email on our phones, much fewer people use the Internet in other ways.
write and receive emails.
compare the ways people use smartphones these days.
of using the gadgets .
respondent claims to do that, 79 and 78 percent respectively.
3. Fill in the gaps using the words below.
Firstly according to Also Therefore Moreover As we can see For example Secondly calls communication less Smartphones Probably
__________(1) became one of the most important parts of our everyday lives during the past few years: people use them not only for __________(2), but also for a range of different purposes. . I have found some useful data on the issue of what people use their smartphones for in Zetland and organized it into a bar chart.
__________(3), it is important to mention that the most common purpose of using a smartphone, __________(4) the diagram, is giving and receiving emails. __________(5), calls are very popular with the users too. __________(6), paying for purchases appears to be the least common aim of smartphone usage.
__________(7), the diagram shows us clearly that paying by a bank card linked to your phone is about two times __________(8) popular than playing games on the device, which can show us that a modern smartphone is a tool for entertainment.
__________(9), smartphones have become a crucial part of life nowadays. __________(10), we already use emails more than real calls, which means that human __________(11) does not interest us as it did a decade ago. __________(12), it can lead to the lack of social skills of the future generations. So, maybe people should spend more time talking to each other (in real life, preferably), because, in the end, we are social creatures.
__________(13), in my opinion, smartphones make our lives by all means convenient, which is great, but we should not let ourselves forget how to spend time without them, because the real world is more fascinating than a device screen.
4. Imagine that you are doing a project on what people use their smartphones for in Zetland. You have found some data on the subject – the results of the opinion polls (see the bar graph).Comment on the data in the table and give your opinion on the subject.
Use the following plan:
– make an opening statement on the subject of the project
– select and report 2-3 main feachers
– make 1-2 comparisons where relevant
– outline a problem that can arise with smartphones and suggest the way of solving it
– conclude and give your opinion on the role of smartphones in our life.
Write 200-250 words.

1. Analyze the diagram data and decide, whether the statements are true or false: